There are several ways of predicting or forecasting the volatility in the currency markets. One of the best and the most widely used method of judging the volatility in the price action of a particular currency pair in the forex market is the use of Bollinger bands. The basic principle behind Bollinger bands is to plot the standard deviation of the prices below and above the simple moving average of the price levels of a currency pair.
This method helps in finding out the volatility in the price of a particular currency pair by creating an envelope around the simple moving average that shows the variation in price levels of a currency pair. If this envelope is thick it means that the market or the particular currency pair is quite volatile in nature and if the envelope is thin it means that there is very little volatility in the market or in the price of the particular currency pair. Bollinger bands are also used for another purpose. They are used to estimate the amount of overbuying and overselling in the currency market.
Following are some of the tips that need to be taken into consideration while using Bollinger bands:
- These bands are plotted either above or below the simple moving average.
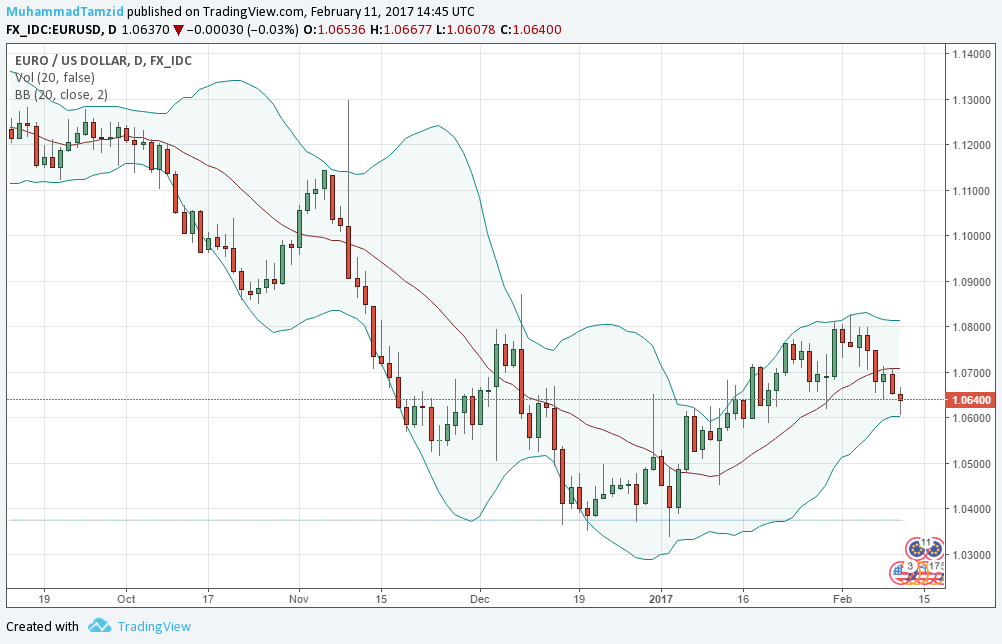
- These are generally plotted for 20 time periods but the duration can be easily modified or changed according to need or convenience.
- The default setting for the two bands is two standard deviations above or below the simple moving average.
- One thing that needs to kept in mind while using these bands is that if you are changing the time periods you should also change the standard deviation between the bands. For example, if you are increasing time period to 50, then increase standard deviation to 2.5.
- The time frame used to find out the volatility using Bollinger bands can be very easily varied from 5 minutes to daily to monthly or even yearly.
- The tightening of the bands is generally followed by rapid movement of the prices.
- A sure shot sign of exhaustion is a move outside the band followed by a sharp retracement.
- The movement of price in the upper Bollinger bands is a sign of strength and the movement of prices in the lower Bollinger bands is a sign of weakness.
These are some of the tips that need to be taken into consideration while using Bollinger bands to determine the volatility in the market. Apart from this, one must realize that no estimation technique is perfect, so some amount of care should be taken while using this technique to look for profitable trades in the market.