Surprising Benefits of Swing Trading

The main purpose of online forex trading is to augment your forex trading account with the passing of time. It is not a way to make a quick buck on the trading platform, as most people believe, and it takes time, effort and hard work to make good money from FX trading.

There are four primary approaches to forex trading.

  • Scalping
  • Day trading
  • Swing trading
  • Position trading

With position trading, positions remain open for months or even years. Investors keep a close eye on daily forex news to stay afloat in economic circumstances. They also perform technical analysis to execute their trades. Though position trading has the potential to be very profitable, it also requires a huge initial capital.

On the other end of the spectrum is scalping and is one of the riskiest strategies an online trader can take. It is fast-paced, illogical and unplanned. Scalping is likened to gambling by many successful investors and magnates such as Warren Buffet state that scalping brings very little benefit to the forex trading world.

Instead, investors should stick to safer strategies that are carefully planned and executed. Swing trading is a ‘medium-term’ investment approach that involves holding a position open for days or weeks – no less and no longer. It involves letting the trade run its course while you think on a bigger scale in terms of profit.

What are the Benefits of Swing Trading?

Swing trading doesn’t appeal to everyone. It’s typically considered too boring to be worthwhile as there is lots of waiting involved.

But swing trading possesses endless benefits: you need less time on the trading platform but are financially better off in the long run. You will experience less stress overall as you can set up your trade on the trading platform, including stop losses and take profit orders, and leave the trade to run its course while you go about your business.

In addition, you only need to check the market once or twice each trading day. You simply take advantage of momentum has it presents itself, until its run its course. Using price action trading combined with swing trading, you can capture the majority of trend movements and benefit from the profits in your forex trading account. You will gain an edge in the market and will always be one step ahead of the trading game.

How to Use Different Types of Forex Charts

How would you know if your currency portfolio is overpriced or underpriced? Or whether you should buy, sell or hold the currency pair? Surely, you do not invest your hard-earned money on the basis of your sixth sense or sentimental financial analysis.

Well, there are two reliable and objective ways for you to analyze the forex market and predict the future value of currencies. These are fundamental analysis and technical analysis. Both have their own advantages and disadvantages. Here, we will talk about the latter method, which is comparatively more popular and widely used in the forex trading market.

Technical analysis is associated with different types of charts that depict the past performance of the specific asset. Below, we have outlined how to use forex charts in a simple manner.

Graph Chart

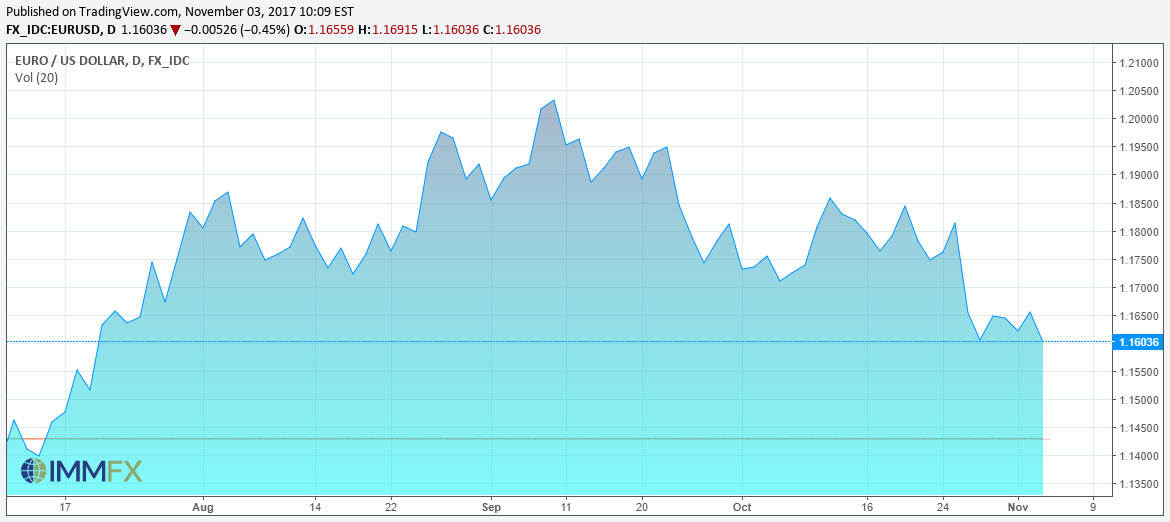
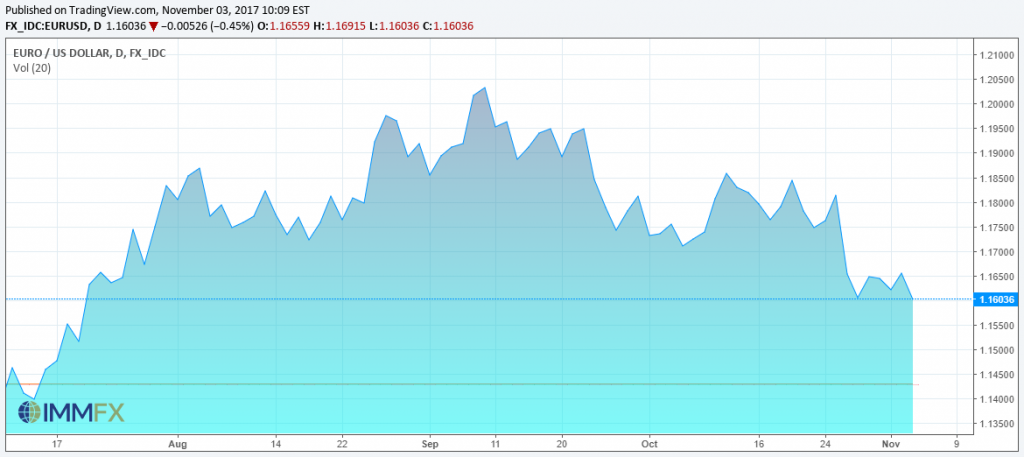
The most basic type of forex chart is a line graph. As the name indicates, a line represents the past performance of the market. A line chart makes it very easy to identify steep and sharp turns. The closing price of the market or any specific currency pair is plotted against time. The image below is an example of a line graph.

Graph Chart

Bar Chart

The bar chart is favored more than a line graph by forex traders. This biasness is due to the fact that unlike a line graph, a bar chart shows some additional information. For example, a line graph depicts the closing value of a currency in the specific time period, whereas a bar chart shows the opening, closing, high and low price as well. You can plot several variables in a single chart. A typical bar chart is shown below.

A bar graph is more appropriate for short-term trading and active traders. For example, a bar graph tells you at which time the market usually touches its high or low point. This would tell you when to buy or sell if you intend to trade for a day or even for a few hours.

Candle Stick Chart

The candle stick chart has its origination in the Japanese rice market where candle sticks were used to count and analyze the rice trading contracts. This forex chart is quite similar to the bar graph in the sense that it displays the same type of information. You can plot the opening, closing, high and low price in the same graph. The image below illustrates how the four prices are plotted on the candle stick.

The traditional candle stick charts were composed of two colors, where a white candle stick represented that the market closed higher than it opened, and a black stick meant that the closing price of the market or the specific currency pair is less than the day’s opening price. These days candle sticks are generated in different colors.

Conclusion

Apart from the above mentioned charts, there are several other types of forex charts like the Heikin-Ashi chart and the Renko chart that are used by forex traders. However, these are less popular and very rarely used. Line, bar and candle stick charts are the most reliable and effective way of technical analysis in the forex trading industry.